Price
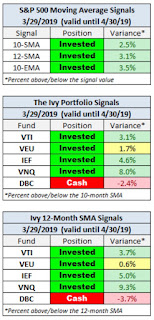
Source: dshort blog, Moving Averages: March Month-End Update
Jill Mislinski writes the following summary for this month at the dshort blog:
All three S&P 500 MAs are signaling "invested" and four of five Ivy Portfolio ETFs — Vanguard Total Stock Market ETF (VTI), Vanguard FTSE All-World ETF (VEU), iShares Barclays 7-10 Year Treasury (IEF), and Vanguard REIT Index ETF (VNQ) — are signaling "invested".This represents the second month in a row that both VTI and VEU have signaled "invested" rather than "cash." The S&P 500 index is within 2% of its all-time closing high of 2,930 reached September 20, 2018. With growth decelerating from the peak reached in 2018, can the U.S. market appreciate to an all-time high? Listen to Lakshman Aschutan's video from Real Vision to learn more about our current business and growth rate cycles.
Sentiment
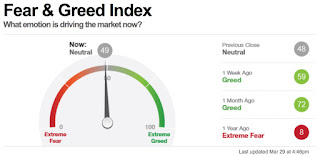
Source: CNN Business Fear & Greed Index
In our March update, I suggested sentiment data from the CNN Business Fear & Greed Index likely peaked at the end of February based on information from Tim Knight at the Slope of Hope blog. This sentiment index fell from 72 last month to 49, hence this index is "neutral" to start April. Last month, only one of the seven components of this index measured "fear" or "extreme fear"; this month, the number has increased to three components. Will sentiment reach 2019 highs in April? Let's list domestic data likely to impact sentiment in April: the employment situation summary (released Friday, April 5, 2019), news from 1Q earnings reports (starting mid-April), and Q1 2019 GDP advanced estimate for the U.S. economy (released April 26, 2019). Global news impacting markets and sentiment for this month include: Brexit, China/US trade deal, and USMCA passage through Congress.
Valuation
Source: Gary Cardiff, Sound Advice Newsletter via Marketwatch
Repeating what I wrote in the September 2018 update:
As I continue to look for valuation metrics describing this market, Mark Hulbert's article from August 22, 2018 about the "Sound Advise Risk Indicator" deserves highlighting. The “Sound Advice Risk Indicator", the brainchild of Gray Cardiff, editor of the Sound Advice newsletter, is derived from the ratio of the S&P 500 SPX to the median price of a new U.S. house. For the first time since the late 1990s, and for only the sixth time since 1895, this indicator has risen above the 2.0 level that represents a major sell signal for equities. Please read Mark Hulbert's article titled, Opinion: The stock market’s latest sell signal has happened only 5 other times since 1895, to learn more about this valuation measurement.Since this market signal occurred in August 2018, I've learned that it can signal a market top from one month to four years from it being measured. Between this indicator and Hussman's chart below, it is clear the market is telling us it is in a topping process.
Summary
Price action continues to signal "invested" for stocks as we begin April, sentiment is "neutral" and valuation is elevated. Investors remain hopeful for a soft landing for the decelerating U.S. growth cycle. The equity surge to begin 2019 shows how much faith investors have in the Federal Reserve pausing rate increases (which is bearish), ECB stimulus, and a positive U.S./China trade deal.
The yield curve inverted during the month of March, which has historically preceded recessions and reinforces the late economic cycle expansion currently occurring in the United States. Here is a chart showing the sequence of events with regard to the last 7 U.S. yield curve inversions and how they related to the S&P 500 and economic cycles:
Source: Capital Economics via Marketwatch
If you want to learn more about the impact of inversions on the U.S. economy please read Liz Ann Sonders --Chief Investment Strategist, Charles Schwab & Co., Inc.-- market commentary Blue, Red, and Grey: Yield Curve Inversions. For a more accurate market signal regarding a set of criteria that has typically preceded tops in the stock market, let's review this graph John Hussman published on twitter on March 28:
Please click to enlarge
Source: Hussman Strategic Advisors, via twitter
Hussman's graph shows, with red bars, every time the 10-year Treasury yield was less than the 3-month Treasury yield; the S&P 500 was below its level of 6-months earlier and the S&P 500 was within 8% of a record high. Now, let's review the business cycle.
Business Cycle Update
Source: Fidelity
If you compare this chart to last month, you'll notice Fidelity has pushed the U.S. closer to a contraction period in the business cycle, although they remind investors that there are currently no signs of a recession in their data. To summarize, the growth cycle is beyond its peak, reached in the middle of 2018, and we are waiting to see if the data will reveal a soft landing for the growth cycle or a recession for the U.S. economic cycle. The decelerating growth cycle can clearly be seen on the chart below of U.S. GDP growth rates:
Source: Trading Economics
This chart (above) inspired the heading for this blog post. Headline GDP growth for Q1 2019 is expected to have a 1 as the first number, hence the 4, 3, 2, 1 pattern. When GDP growth is decelerating, the natural question is: what impact will that have on earnings? Here is a chart showing earnings expectations for 2019 using data from FactSet (remember 2018 earnings benefited from tax cuts, which make comparable year-over-year estimates challenging):
Source: WSJ via Fidelity
This earnings pattern is lackluster and seems like a challenging environment for the S&P 500 to reach new all-time highs. The current U.S. economic expansion started June 2009 and if it lasts until July 2019 it will rank as the longest expansion in U.S. history. During this business cycle, the U.S. has experienced three decelerations and accelerations in the growth rate: 2010-2011, 2012-2013, and 2015-2016. Right now we are in our fourth growth rate cycle deceleration during this "huge" economic expansion. This deceleration stands out from the prior three because it includes an inverted yield curve; it is very possible this growth cycle downturn and the economic cycle downturn could overlap. We will continue watching the data. Let's end with a quote inspired by Lakshman Achuthan: "We've survived 47 recessions in the history of the United States. We will survive [the next one]."
Please consult a qualified financial advisor before making any investment decisions. This blog is for educational purposes only and does NOT constitute individual investment advice.As always, wise investing my friends.
--------------------------------------------------------
Here's what I've been reading and watching recently:
- Schwab Market Perspective: Market Madness (Schwab)
- The ETF Tax Dodge Is Wall Street’s ‘Dirty Little Secret’ (Bloomberg Businessweek)
- China's Currency Cliff with Kyle Bass (Real Vision)
- The fees on your ‘529’ tuition-savings plan matter more than ever (WSJ via Fidelity)
- Cycling into Slowdown with Lakshman Achuthan (Real Vision)
- Half of Older Americans Have Nothing in Retirement Savings (Bloomberg via Yahoo Finance)
- We Are Witnessing A Different Kind Of Stock Market Euphoria (Jesse Felder via Hedgeye)
- “If Time is Money, Money Can Also Buy Happier Time.” (Gretchenruben.com)


