Price
Source: dshort blog, Moving Averages: February Month-End Update

As a recent market commentary from Schwab began, "65%! That’s the annualized gain for 2019 if the S&P continues along the pace of gains registered year-to-date." This aggressive rise in the market to start 2019 actually began right after Christmas Eve 2018. What Schwab's commentary failed to highlight is the S&P 500 remains roughly 5% lower than market highs reached on September 21, 2018. Keep these reference points in mind as you read Jill Mislinski's moving averages update for the end of February at the dshort blog:
"All three S&P 500 MAs are signaling 'invested' and four of five Ivy Portfolio ETFs — Vanguard Total Stock Market ETF (VTI), Vanguard FTSE All-World ETF (VEU), iShares Barclays 7-10 Year Treasury (IEF), and Vanguard REIT Index ETF (VNQ) — are signaling 'invested'."Notice VEU and VTI switched to "invested" from "cash." An "invested" signal for VEU marks the first time we've spotted that reading since the end of May 2018.
Sentiment
Source: CNN Business Fear & Greed Index

Source: CNN Business Fear & Greed Index

The two graphs above show the CNN Business Fear & Greed Index with its current level of 72 "Greed" and where that level is relative to recent performance of the index. Let's start with reviewing the second graph showing the index values over time. It's fairly obvious investor sentiment is almost as greedy as it has been at any point since the beginning of 2018. If this index reaches 80, we'll experience the most greedy sentiment readings since late 2017.
As we begin March, two of the seven components of this index register "Neutral" and one indicates "Fear." Junk Bond Demand and Market Volatility are "Neutral." Market Momentum signals "Fear." Will the index hit "Extreme Greed" before this rally ends? If the next chart, below, has captured a correct warning sign from the AAII Sentiment Survey then the CNN Business Fear & Greed Index is probably closer to reversing than pushing dramatically higher.
Please click on chart to enlarge

Source: Warning Signs from AAII Sentiment, Slope of Hope blog
Tim Knight wrote the following for the Slope of Hope blog after the American Association of Individual Investors (AAII) most recent sentiment report:
"Bullishness is now up OVER the 40 level – which usually marks market reversals. Bearishness has collapsed. In the S&P500 chart below I have noted those dates in the recent past where Sentiment was at similar levels (Bullishness ~40, Bearishness less than 30). You can follow along with the red circles on the sentiment results above."If you read his entire post, he shows a table with the last few times the Sentiment survey showed similar results and how those correlated with turning points in the market. Will March be another turning point? We'll know next month.
Valuation
Source: multiple.com

Current S&P 500 Price to Sales valuation indicator hit a low in March 2009 and a high in September 2018 showing its usefulness in measuring highs and lows in the market. Reviewing Current S&P 500 Price to Sales ratio shows an elevated market since 2016, and the current reading of 2.11 to start March reveals long-term investors willing to be patient may have better entry points to deploy capital.
Summary
Positive returns for March wouldn't surprise me, however softening macroeconomic conditions, greedy sentiment readings and high valuations lead me to conclude it's time for tactical investors to shift to a slightly defensive position (regardless of if we see more bullish short-term chart chasing). Watch your asset allocation, position sizes, and consider booking some gains.
At the very least, if you prefer to buy-and-hold investments, know that your return expectations should be muted over the next few years for U.S. broad indexes like the S&P 500. Someone might say: you cannot write such nonsense! And my argument back to them revolves around understanding what 138 months of growth looks like for the U.S. economy. If you're having a hard time imaging such a scenario it's because it has never happened. Why am I picking 138 months? That's the amount of time from 6/1/2009 (beginning of economic expansion) to 12/1/2020 (right after the next U.S. Presidential election). No one wants to experience a business cycle contraction, but like night follows day it's part of our capitalist system and I don't believe anyone at the Fed or on Trump's economic team will change this pattern. One of the most noted economists in the United States, former Federal Reserve Chairman Alan Greenspan, this month continued to publicly acknowledge the increasing likelihood of stagflation coming to the United States and highlighted the consequences of U.S. deficit spending.
Looking Forward in the Business Cycle
Please click on chart to enlarge.

Source: Fidelity.com, Market outlook: Increased uncertainty
Fidelity recently shared these three takeaways about the markets based on the current business cycle:
- Recession risk in the US remains low, and the US consumer backdrop is strong amid a low unemployment rate.
- Global growth remains positive but has become more uneven.
- We expect the late-cycle environment to provide a less favorable risk-return profile for asset markets than during recent years.
Please click on chart to enlarge
Source: Heartland Advisors
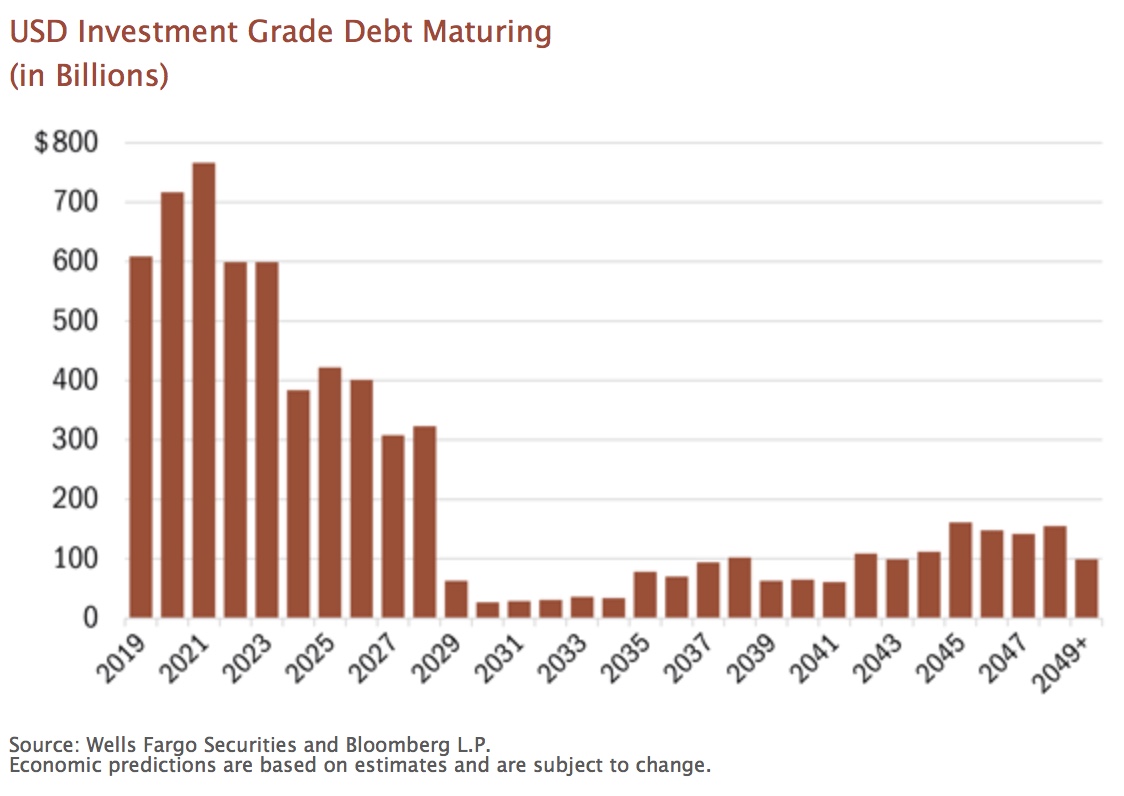
Will Nasgovitz, CEO of Heartland Funds, recently posted A $3 Trillion Time Bomb? on February 19, 2019. The following is an excerpt about the state of corporate debt from his article:
"The sheer volume would be challenging for the market to digest in the best of scenarios, let alone this late in an economic expansion. Adding to our sense of caution are early signs that lending standards have begun to tighten for commercial and industrial borrowers. As banks become more stringent, borrowers could find themselves paying higher rates just to secure the capital they need to retire outstanding obligations."Aswath Damodaran, Professor of corporate finance and valuation at the Stern School of Business at New York University, launched a YouTube video on February 4, 2019 to address the issue of corporate debt. He makes a case that debt is not the issue; the issue is the strategy a company pursues when acquiring debt. Time will tell if all of this corporate debt will have negative consequences on equity markets in the next few years. To read one more perspective on this topic please read Steve Romick's interview with Barron's Senior Editor Leslie Norton. Steve Romick along with Mark Landecker and Brian Selmo manage the $17 billion FPA Cresent Fund. Let's end with a quote from Howard Thurman, philosopher and theologian:
"Don't ask yourself what the world needs, ask yourself what makes you come alive, and then go do it. Because what the world needs is people who have come alive."As always, wise investing my friends.
Please consult a qualified financial advisor before making any investment decisions. This blog is for educational purposes only and does NOT constitute individual investment advice.--------------------------------------------------------
Here's what I've been reading and watching recently:
- The Feedback Fallacy (Harvard Business Review)
- You’re the ‘Money Person’ in Your Relationship? That’s Problematic (NY Times)
- Business Cycle vs. Market Cycle: What’s the Difference? (Schwab)
- The Beginning is the End is the Beginning: A Look at Recessions (Schwab)
- Why the stock market might soon careen down a dangerous ‘slope of hope’ (MarketWatch)
- Where Investors Put Their Money in 2018 (Visual Capitalist)
- Glenn Hubbard & Joseph Stiglitz (Graham & Doddsville)
- One big reason to move your family out of certain cities — and fast (MarketWatch)
- Our 2019 Annual Letter (Bill and Melinda Gates)
- January 2019 Data Update 7: Debt - Neither Poison nor Nectar!(NYU Professor via YouTube)