Price

Source: dshort blog, Monthly Moving Averages: December Month-End Update
At the end of December, Jill Mislinski wrote the following for the dshort blog:
All three S&P 500 MAs are signaling "cash" and four of five Ivy Portfolio ETFs — Vanguard Total Stock Market ETF (VTI), Vanguard FTSE All-World ETF (VEU), Vanguard REIT Index (VNQ), and PowerShares DB Commodity Index (DBC) — are signaling "cash."As I noted after reviewing the "November Month-End Update" last month, I did not want to chase the "invested" signal for VTI at the beginning of December. The market price action is starting to whipsaw which creates a challenging environment for followers of the Ivy Portfolio system. If you incorporate tactical investing into your investment process, each month delivers another set of data to help you decide where you should be allocating your capital. As we start 2019, IEF is the only asset class signaling "invested" according to the Ivy Portfolio system. VEU has indicated "cash" rather than "invested" since the end of May 2018. International markets have been dealing with substantial issues including Brexit, Italian debt and budget issues, German economic slowing, China economic slowing and these issues will continue to weigh on global markets as we enter 2019.
Sentiment
Source: CNN Business Fear & Greed Index

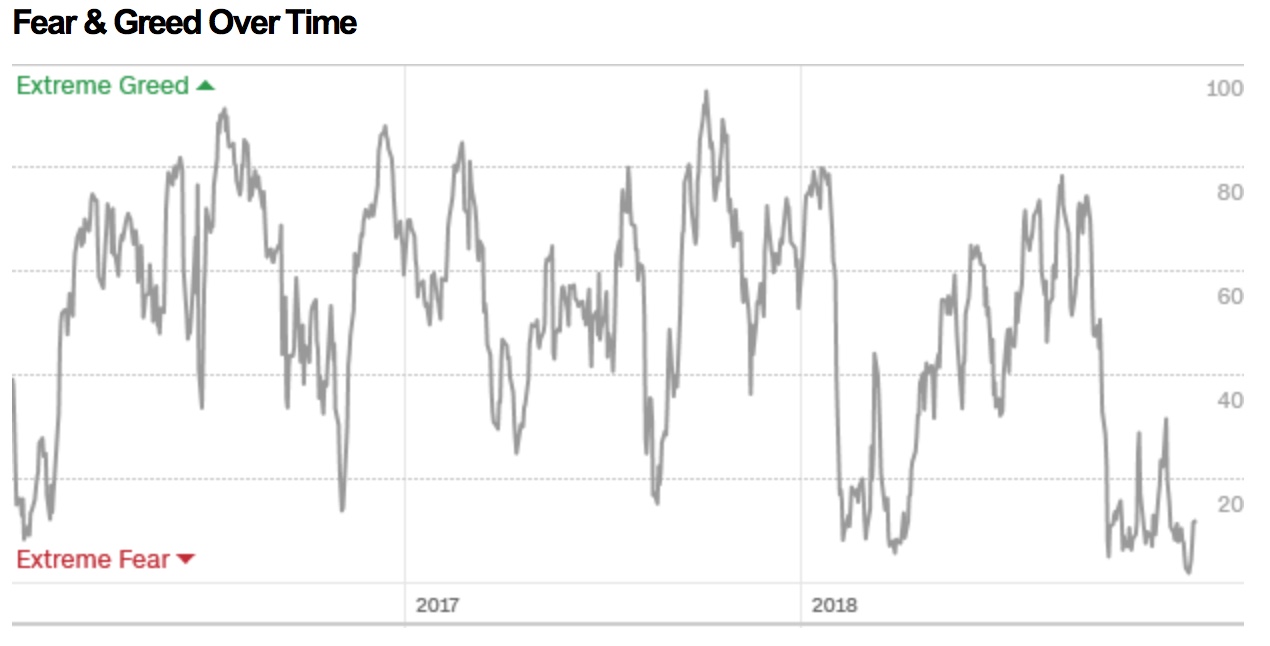
This index last registered "Neutral" at the end of September. Since the middle of October, the Fear & Greed Index has been measuring "Fear" or "Extreme Fear." As we start 2019, none of the components of this index read "Greed" or "Extreme Greed." As of December 31, 2018, two components -- "Market Volatility" and "Put and Call Options" -- measure "Neutral." The remaining five components measure "Extreme Fear." During the month this index reached the lowest reading that I can remember of 2 on Christmas Eve. Looking at this index over time you can see the significant drop during the dual corrections of 2018:
Source: CNN Business Fear & Greed Index
Valuation
I'm going to drift a bit on our conversation of valuation today to look at stock returns relative to the unemployment rate. Leuthold Group introduced me to the concept of stocks disliking low unemployment in August 2018. On October 23, 2018 Mark Hulbert shared an opinion piece on MarketWatch titled, Low Unemployment on Main Street is a Warning Sign for Wall Street, where he highlighted the low 12-month inflation-adjusted returns depending on the initial unemployment rate. He created the following chart to illustrate this concept:
Source: HulbertRatings.com via MarketWatch

Mark Hulbert summarized today's environment succinctly when he wrote, "The historical data suggest that investors are on shaky ground celebrating the bull market’s longevity and that unemployment is at historic lows." The record setting economic expansion ended in March 2001 at 120 months and our current expansion is 114+ months. If the expansion lasts past June of 2019 this will become the longest U.S. economic expansion on record.
Summary
Price action is defensive to start the year with only IEF signaling "invested." Sentiment begins the year "Extremely Fearful" however off the lows of Christmas Eve. Valuation is improving however we don't know how much valuation numbers will have to adjust to decelerating profit margins. Make sure to highlight March on your 2019 calendars. Donald Trump and Chinese President Xi Jinping agreed to delay the planned Jan. 1 U.S. hike of tariffs to 25 percent from 10 percent on $200 billion of Chinese goods until March 1, 2019. They have two months to negotiate a trade deal. The UK is scheduled to leave the EU at 11pm local time on March 29 2019.
At the end of 2019, will investors look back at the fourth quarter of 2018 as the beginning of pricing in a slowdown or the end of a "volatility event" which just presented a buying opportunity for stocks? The latest Duke University/CFO Global Business Outlook quarterly survey released in December shows 82% of CFOs believe a recession will have begun by the end of 2020, with 49% thinking a recession will have arrived by the end of 2019. Liz Ann Sonders, Senior Vice President, Chief Investment Strategist at Schwab, published an article on December 17, 2018 titled: 2019 Market Update: Ten Years Gone where she wrote:
"Most of the deterioration in U.S. economic data has been subtle and/or somewhat under the surface. But as I always like to highlight—especially at possible inflection points in the cycle—when it comes to the relationship between economic data and the stock market, 'better or worse tends to matter more than good or bad.'”To illustrate her point, GDP looks like it will worsen on a year-over-year basis beginning with the Q4 2018 GDP number released on January 30, 2019. This expected reality of viewing comparatively worse numbers should continue through at least Q3 2019. As an example, Q2 2019 will need to compare against 4.2% GDP growth in Q2 2018. The market decrease in Q4 2018 has priced in a worsening of the economy, however the key question is has the market dropped enough to price in decelerating global economies impact on stocks? For review, here is the GDP data since January 2016 (please click on the chart to enlarge):

Source: Trading Economics
If you haven't committed to reading Van R. Hoisington and Lacy H. Hunt, Ph.D. quarterly reviews, I highly recommend visiting their site to read their updates. Here is a quote from the Hoisington Investment Management Quarterly Review for the Third Quarter of 2018:
"The U.S. economy appears to be on a steadily declining path to recession and disinflation/ deflation. This may seem improbable in the face of record year-over-year growth in nominal GDP over the past decade. Additionally, the U.S. has experienced record stock prices, record confidence levels, a steady upward march of coincident economic indicators and the lowest unemployment rate (3.7%) reported in the past 49 years. These statistical measures, along with many others, however, carry no weight regarding future economic activity. Monetary policy has played a major role in determining recessions. But, unlike the past, the government's debt level has reached such extreme heights that, like monetary policy, it is also serving to restrain economic growth going forward. An analysis of these factors leads to the inescapable conclusion that a bumpy landing is in store for the U.S. economy."Let's end this update with this quote:
No act of kindness, no matter how small, is ever wasted. – AesopAs always, wise investing my friends.
Please consult a qualified financial advisor before making any investment decisions. This blog is for educational purposes only and does NOT constitute individual investment advice.--------------------------------------------------------
Here's what I've been reading and watching recently:
- Hedge Fund Legend Ray Dalio on the Economy (Business Insider via YouTube)
- How to Prepare for the Next Global Recession (The Economist via YouTube)
- CFO Survey -- Recession Considered Likely by Year-End 2019 (Duke University)
- Hide Your Phone When You’re Trying to Work. Seriously. (NY Times)
- Carbon Taxes at the Barricades (Project Syndicate)
- Office Hours Summary…You Are Not Alone (Meb Faber Research)
- Paul Volcker’s Wisdom for America’s Rigged Economy (New Yorker)
- Over 5 million workers will have higher pay on January 1... (EPI)
- Bridgewater's Jensen forecasts 'near-recession-level growth' in 2019 (Reuters)