The S&P 500 was up 0.98% in December. When we examine global securities via the Morgan Stanley Capital International All Country World Index (MSCI ACWI, iShares ETF ACWI), which represents 85% of the global investable equity market, it has been up a record 14 months in a row. The main story about the market in 2017 is the total lack of volatility. The S&P 500 has not had a 3% or greater correction since November 4, 2016. Let's review price, sentiment and valuation as we start 2018.
The Ivy Portfolio Signals had one asset class switch to cash as we start the year. It was IEF, which seeks to track the investment results of an index composed of U.S. Treasury bonds with remaining maturities between seven and ten years. VNQ, the ETF representing REITs, is close to signaling cash (but not yet). The remaining asset classes as represented by VTI, VEU, and DBC all ended December signaling investors should be invested in these asset classes.
Sentiment
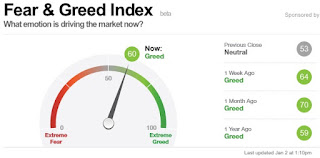
Source: CNN Money Fear & Greed Index
The CNN Fear & Greed Index has been in a range between 50 and 80 since November. It started 2018 bouncing between 53 and 60 slightly more greedy than neutral. If a melt-up in the market is in store for 2018 I'd anticipate this index revisits "Extreme Greed."
The Price to Sales ratio or Price to Revenue ratio, which measures how expensive the S&P 500 is relative to the cumulative sales of the S&P 500 companies over the last 12 months, is indicating the market is starting the year at the highest Price to Sales ratio since data is available on multpl.com. If you click on the link you'll notice that the low for the ratio was in March of 2009. As we've discussed for longer than a year, overvaluation doesn't cause bear markets. Stocks continue to ride the momentum of this rally partially because inflation and bond yields are low. It is possible that investors are currently buying expensive stocks rather than expensive, low yielding bonds. As the Fed continues to raise interest rates, possibly four times in 2018, when will that start to throw cold water on this red hot stock market? Lastly Liz Ann Sonders, Sr. Vice President and Chief Investment Strategist at Charles Schwab, posted this chart in her December 18, 2017 article Whole Lotta Love...for Tax Reform? It illustrates the point that stocks still are inexpensive compared to bonds, but expensive on 10 out of the 13 criteria she chose to analyze.
Please click on chart to enlarge.
Source: Charles Schwab Market Commentary, Whole Lotta Love...for Tax Reform? by Liz Ann Sonders
Summary
Beginning 2018 monthly moving average indicators reveal to be invested in all asset classes except 7-10 year treasuries as represented by IEF. Sentiment remains greedy. Multiple asset classes remain overvalued. Most seasoned investors acknowledge that it has been a long time since a normal stock market correction, but as Bill Miller reminded us in July 2017, "It is a bull market you know." Let's end this month with this quote from Terry Pratchett: "Wisdom comes from experience. Experience is often a result of lack of wisdom."
As we start 2018, wise investing my friends.
Please consult a qualified financial advisor before making any investment decisions. This blog is for educational purposes only and does NOT constitute individual investment advice.
--------------------------------------------------------
Here's what I've been reading and watching recently:
- My Favorite Charts (The Irrelevant Investor)
- Pros vs Amateurs in Financial Services (Reformed Broker)
- Bull Market is Very Much Alive: BMO's Brian Belski (CNBC)


