Price
Source: DSHORT BLOG, Moving Averages November Month End Update
For two months in a row the Vanguard Total Stock Market ETF (VTI), Vanguard FTSE All-World ex-US ETF (VEU), iShares Barclays 7-10 Year Treasury (IEF), and Vanguard REIT Index ETF (VNQ), and PowerShares DB Commodity Index (DBC) moving averages are all signaling "invested" at the end of the month. Let's see if the S&P 500 can continue another month without a 3% or more correction, as Bespoke Investment Group illustrated with the chart below:
As you can clearly see, this market has set a record for the most days without a 3%+ correction after a 3%+ rally.
Sentiment
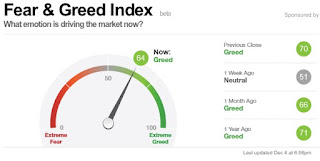
Source: CNN Money Fear & Greed Index
The CNN Money Fear & Greed Index started December with a reading of 64, down from 72 on the first of November. This indicates investors are still greedy as we start November, but that enthusiasm may be diminishing.
Valuation
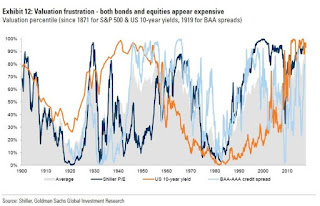
Let's turn today's discussion on valuation over to Mark Kolakowski writing for Investopedia.com describing an analysis provided by Goldman Sachs Group. On December 6, 2017, he wrote an article titled Investors Face 'Pain' In Highest Stock, Bond Values Since 1900. Here is his summary of Goldman's Analysis:
To measure stock market valuation, Goldman used the cyclically-adjusted P/E ratio, also known as the CAPE ratio or the Shiller P/E ratio after its developer, Nobel Laureate in Economics Robert Shiller of Yale University. The CAPE smooths short-term fluctuations in valuations by comparing current stock prices to average earnings over the prior ten years.
For bonds, they looked at the yield on 10-Year U.S. Treasury Notes. To measure the cost of credit, they calculated the average yield spread between bonds of AAA quality, the highest grade, with those judged to be BBB or Baa, the lowest investment-grade rating. The narrower this spread is, the less investors are being compensated to take on the additional risk, and the cheaper credit has become.
Next, Goldman ranked all the observations in all three categories since 1900. The higher the CAPE ratio, the higher stock valuations are. The lower the T-Note yield, the higher bond valuations are. The lower the credit spread is, the higher credit valuations are for the purposes of this analysis. On average, all three valuation measures are now within the highest 10% of readings that they have registered since 1900, per Goldman (see graph Exhibit 12 below). This is a first, Bloomberg adds.

Click on image to enlarge
Source: Bloomberg, Goldman Warns That Market Valuations Are at Their Highest Since 1900
Summary
Price action indicates investors should remain invested in multiple asset classes, sentiment readings continue to show investors -in aggregate- are greedy, and valuations remain elevated for multiple asset classes.
Further reading about the market:
A bull market should make investors happy. This one isn't by Landon Thomas Jr. The New York Times News Service, 11/05/2017
I Melt with You: Anatomy of a Market Melt Up by Liz Ann Sonders, Schwab, 12/04/2017
How Expensive are Stocks? The Big Picture blog, 12/06/2017
Let's end this monthly update with this quote from Richard Bernstein, a former equity strategist at Merrill Lynch who now runs his own investment firm:
"You cannot invest successfully when you are crouched under your desk in a fetal position."He is correct, investors should focus on the fundamentals of the economy and corporate earnings and avoid being distracted by their ability or lack of ability in anticipating remote calamaties (i.e. Wars, large scale natural disasters, etc). I would take it a step further and suggest that investors concerned about retirement need to focus first on their net worth, personal health and cash flow situations.
As always, wise investing my friends.
Please consult a qualified financial advisor before making any investment decisions. This blog is for educational purposes only and does NOT constitute individual investment advice.


