Price
Source: dshort blog, Moving Averages: July Month-End Update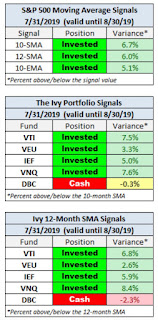

Jill Mislinksi writes the following at the dshort blog:
All three S&P 500 MAs are signaling "invested" and four of five Ivy Portfolio ETFs — Vanguard Total Stock Market ETF (VTI), Vanguard REIT Index ETF (VNQ), Vanguard FTSE All-World ETF (VEU), and iShares Barclay 7-10 Year Treasury (IEF) — are signaling "invested".Both U.S. and foreign stocks switched from "cash" to "invested" at the end of June. Looking at a two year chart of the S&P 500 it looks like a topping process is continuing which started in January of 2018. Going into August, the setup for stocks couldn't be much worse. REITs have signaled "invested" since the end of January this year and treasury bonds have signaled "invested" since the end of November 2018. Commodities have signaled "cash" since the end of October 2018 and almost switched to "invested" at the end of July, however declines on the last trading day of the month kept DBC in a "cash" position for another month. As I've mentioned for the last few months, watch the WTI crude chart for signs of weakness or strength in the economy. WTI price peak for 2019 remains April 23 at $66.30 ($US/bbl).
Sentiment
Source: CNN Business Fear & Greed Index
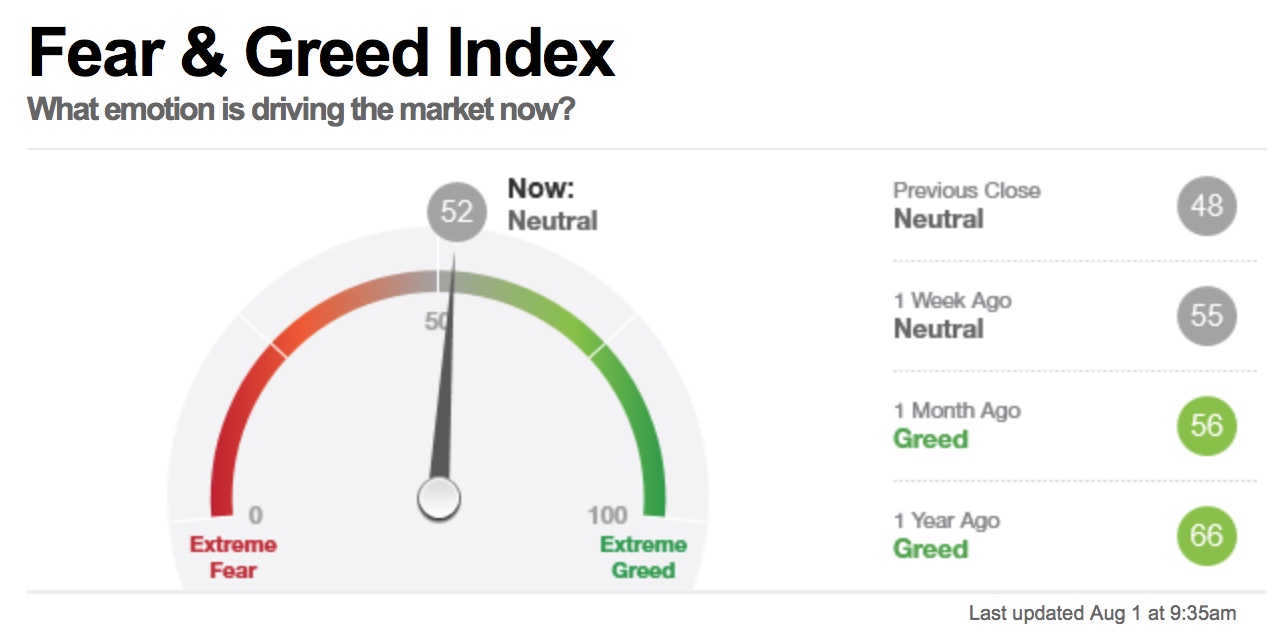
The CNN Fear & Greed Index started the month of August at "neutral." This reading is almost identical to where we started last month. As of this writing, on August 1, this index has dropped to 43, after President Trump threatened China with more tariffs. It seems Trump is trying to manipulate the Fed into more aggressively lowering interest rates to help boost economic growth prior to the 2020 election. President Trump clearly thinks lower rates will increase growth and more than offset negatives from his tariffs. On August 1, the CBOE Volatility Index (VIX) shot higher, this pattern reminds me of early May 2019.
Valuation
Source: multpl.com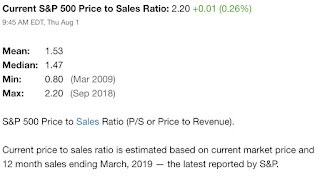
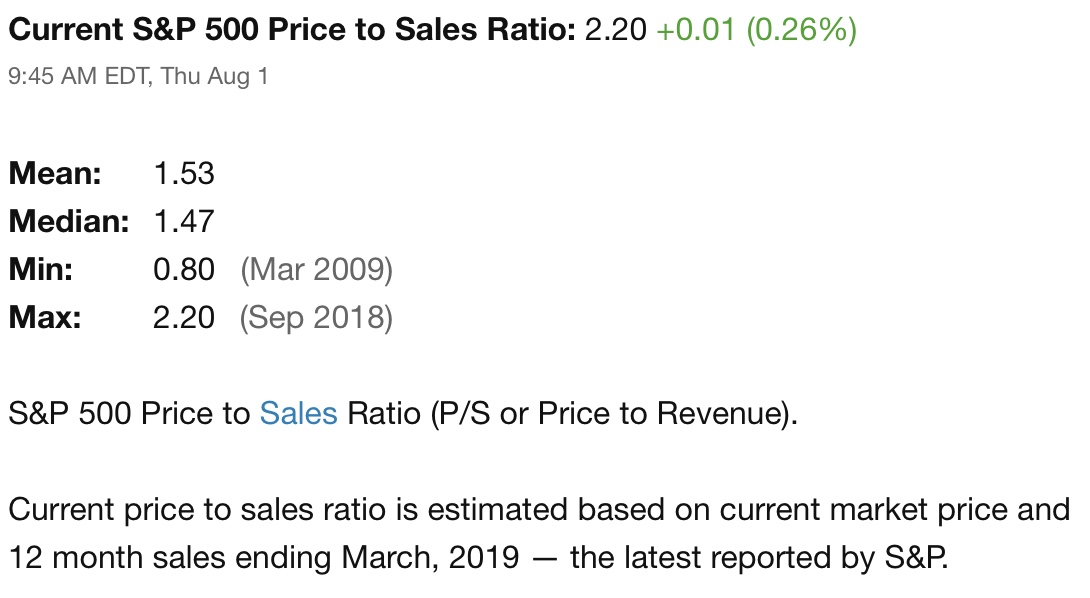

The Price to Sales ratio for the S&P 500 started August at all time highs, indicating the S&P 500 is currently as expensive as it was in September of 2018 right before the October decline in the S&P 500. Let's keep watching this indicator to see how Trump's tariffs, tariff threats, and a Federal Reserve rate cut impact it over the coming months.
Summary
Price action, according to the Ivy Portfolio system, starts August signaling "invested" for four out of five asset classes. However most equity investors should consider booking some profits here. Only one asset class, commodities (DBC), are signaling "cash." Sentiment is neutral and deteriorating. Valuation for U.S. stocks remains elevated.
We are now into the third quarter of 2019 and it is the toughest quarter on a year-over-year comparable basis for the US economy; hence growth and inflation are decelerating which is the worst macroeconomic environment for stocks. The Federal Reserve Board lowered rates because they are concerned that there is slowing global growth and decreasing inflation. Their concern must be significant because the Fed has never lowered rates with the unemployment level at 3.7%. For investors that consider this rate cut a "mid-cycle adjustment," I have a difficult time agreeing. I see no parallels between the 1995-1998 period and today. In that time period technology spending was accelerating because of significant technological advances and updating systems before Y2K. Moreover today the Baby Boomers are older, supply chains from China are being disrupted, many pensions are underfunded and BBB corporate debt (which I've mentioned in prior updates) has grown to unsustainable levels. Moreover, the U.S. economic expansion is officially the longest on record, having advanced for 121 months. The question on my mind is: When will corporate debt buyers and equity buyers stop buying? When they do disappear it could be a waterfall moment for stocks. Reminds me of the old saying on Wall Street, stocks take the escalator on the way up and the elevator on the way down or said another way, risk happens slowly, then all at once. Instead of a quote, let's end this note with a brief discussion about the current level of consumer confidence.
Consumer Confidence
Mark Hulbert wrote an opinion article for MarketWatch on August 1 titled, This highly accurate stock-market predictor just hit its most bearish level since the internet bubble. In his article he highlights two illustrations. The first is a graph of the Conference Board’s Consumer Confidence Index (CCI) from the late 1970's to present. The second illustration, which you'll need to click on to enlarge, shows subsequent market returns from various consumer confidence levels. Mr. Hulbert reported, "The table below reports the performance of the S&P 500 following above- and below-average CCI readings, as well as in the wake of CCI readings that are in the highest 10% of the historical distribution. The latest CCI level is at the 95th percentile, by the way."
Please click on graph or chart to enlarge


Source: MarketWatch, Opinion: This highly accurate stock-market predictor just hit its most bearish level since the internet bubble
As always, wise investing my friends.
Please consult a qualified financial advisor before making any investment decisions. This blog is for educational purposes only and does NOT constitute individual investment advice.--------------------------------------------------
Here's what I've been reading and watching recently:
- Tyrannosaurus Debt: A “Deep Dive” Look at Debt and its Burden(s) (Schwab)
- The IRS Is Tracking Down 10,000 Crypto Owners to Pay Back Taxes (Bloomberg)
- What is the Roth IRA 5-year rule? (Fidelity)
- Shaquille O'Neal Discusses Investing, Franchising, and Donuts (WSJ)
- Will Christine Lagarde Have Room to Run As the ECB’s Next President? (@Wharton)
- Here are the countries with the most U.S. retirees collecting Social Security (MarketWatch)
- On the Other Hand (Memo from Howard Marks)