Price
Source: DSHORT Blog, Moving Averages February Month End Update
Accordning to Jill Mislinski, writing at the dshort blog, she summarizes the month end close:
All three S&P 500 MAs[moving averages] are signaling "invested" and three of five Ivy Portfolio ETFs — Vanguard Total Stock Market ETF (VTI), Vanguard FTSE All-World ex-US ETF (VEU), and PowerShares DB Commodity Index (DBC) — are signaling "invested".With VTI, VEU, and DBC signaling "invested" the remaining ETFs VNQ and IEF enter March signaling investors should be in "cash." January market results created a perfect start for bullish investors. February market action showed that the January rally lacked sustainability. February also showed a "hanging man price pattern" as identified by Chris Kimble at Kimble Charting Solutions. The hanging man price pattern has been a precursor to bear markets in the past. Its presence doesn't end the bull market and if the market rises above February's high that would indicate this market still has bullish price momentum. To learn more about the technical indicator Chris identified please click on the chart below to enlarge it or read his blog post: Will Historic Opportunity For Bears Lead To A Bull Market Sunset?
Source: Kimble Charting Solutions blog
If you are interested in price changes and technical charting of the markets I highly recommend that you watch Chris Kimble's free webinar on YouTube: Multi Decade Opportunities in Play and How to Take Advantage. (Note: it is a recorded webinar).
Sentiment

Source: CNN Money Fear & Greed Index
The CNN Money Fear & Greed Index ended February at 12, "Extreme Fear." As I mentioned in last month's update the recent correction did see this index measure below 20 during most of February. When the price action is "invested" and the Fear & Greed index is below 20 that has been associated with a buying opportunity in the market. Currently price action is the most important input in that formula. If price action shifts to "cash" we can ignore the Fear & Greed index until price action shifts back to "invested." Let's be clear, this only impacts investors who are trying to incorporate tactical investing as part of their long term investment plan. If you are following a traditional asset allocation investment program then ignore tactical investing and focus on rebalancing.
Valuation
Let's review three charts describing current equity market valuation. Please follow the links to read more about each chart.
Average of the Four Valuation Indicators at Advisor Perspectives Dshort blog:
Source: Advisor Perspectives, DSHORT blog, Market Remains Overvalued (3/5/18)
Current S&P 500 Price to Sales Ratio:
Source: multpl.com
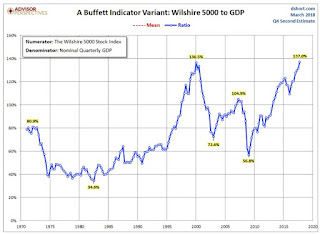
Wilshire 5000 to GDP ratio data from 1950 through Q4 GDP 2017 second estimate:
Source: Advisor Perspectives, DSHORT blog, Market Cap to GDP: An Updated Look at the Buffett Valuation Indicator(3/6/18)
Multiple valuation metrics show the U.S. equity market is trading either at a record or near a record valuation. High valuations have shown to have little to no influence on the near-term direction of markets, but tend to impact returns over ten or fifteen year periods of time.
Summary
Beginning March 2018 three asset classes remain "invested" (VTI, VEU, DBC) and two asset classes signal being in "cash" (IEF, VNQ). Sentiment readings for 2018 have fluctuated wildly from "extreme greed" to "extreme fear." March starts with a reading of "extreme fear." Valuation for stocks remains overvalued, however as we've noted many times the markets can remain expensive for years and overvalued markets have little bearing on short term market direction. The market is starting to signal that it is hitting lower highs, the top in earnings growth might be behind us, and GDP growth rate could be peaking. The most intriguing data point I'm following is the length of this economic expansion. This economic expansion started in June 2009 and we've experienced 105 months of expansion as of March 2018. The longest expansion streak is 120 months (from March 1991 to March 2001). Will this economic streak set a new record? When will the market start to anticipate the end of this expansion? Finally, is the Fed watching this and do they want higher rates before the expansion ends (which will allow them to lower rates if a contraction begins)? We'll wait to see the data. Right now there is enough data to indicate a global growth slowdown may be in the cards for 2018, but I've not seen any data confirming the beginning of a recession. Let's end this month with two quotes:
"Investment performance doesn't determine real-life returns; investor behavior does." - Nick Murray
"When you get to my age, you'll measure success in life by how many of the people you want to have love you actually do love you. That's the ultimate test of how you've lived your life." -Warren Buffett
As always, wise investing my friends.
Please consult a qualified financial advisor before making any investment decisions. This blog is for educational purposes only and does NOT constitute individual investment advice.--------------------------------------------------------
Here's what I've been reading and watching recently:
- When the Story Changes be Alert (Calculated Risk blog)
- Opinion: This Bull Market in Stocks is Barely Limping Along (Mark Hulbert)
- Full Interview on Global Slowdown March 6, 2018 interview (ECRI)
- Where does this Bull Market Rank? (LPL Research)
- Take the Long Way Home: Economic Expansion Gets a Boost (Schwab)


