Price
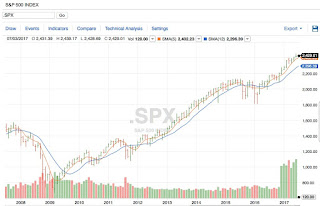
Price action remains positive for stocks. The 5-month simple moving average is trading above the 12-month simple moving average (as illustrated in the above graph) for the S&P 500. Furthermore, the 10-month simple moving average, the 12-month simple moving average, and the 10-month exponential moving averages are signaling to stay invested. Four of the five ETFs — Vanguard Total Stock Market ETF (VTI), Vanguard FTSE All-World ex-US ETF (VEU), iShares Barclays 7-10 Year Treasury (IEF), and Vanguard REIT Index ETF (VNQ) — are signaling invested. Note that IEF is still below its 12-month simple moving average at the start of July. The PowerShares DB Commodity Index Tracking ETF, DBC, currently is trading below its 10-month and 12-month simple moving average indicating to avoid that asset class at present.
Sentiment
Source: CNN Money Fear & Greed Index
As we enter July the market sentiment indicator from CNN Money continues to hover around neutral. This makes sense given the record low volatility we're experiencing in the markets, particularly in June. I keep thinking about this quote from Savita Subramanian, head of U.S. equity and quantitative strategy at Bank of America Merrill Lynch, as I watch the sentiment indicators (I first mentioned this note in the March 2017 update): "We are updating our models to reflect the increasing likelihood that we are entering a typical end-of-bull-market rally, where fundamentals take a back seat to sentiment and technicals."
Valuation
"Elevated asset valuation pressures today may be indicative of rising vulnerabilities tomorrow," Fed vice chairman Stanley Fischer recently warned.
I'm going to turn over today's valuation commentary to Ed Yardeni, of Yardeni Research Inc. On June 8, he wrote the following on his Dr. Ed's blog:
"Valuation melt-up. The Buffett Ratio is back near its record high of 1.81 during Q1-2000. It is simply the US equity market capitalization excluding foreign issues divided by nominal GDP. It rose to 1.69 during Q4-2016. It is highly correlated with the ratio of the S&P 500 market cap to the aggregate revenues of the composite. This alternative Buffett Ratio rose to 2.00 during Q1 of this year, matching the record high during Q4-1999. It is also highly correlated with the ratios of the S&P 500 to both forward revenues per share and forward earnings per share. All these valuation measures are flashing red."
If you want to see a graph of the Market Cap to GDP please click here. As we've discussed expensive markets frequently become more expensive with significant market returns often occurring right before the market changes direction.
Summary
Price action for US stocks remains positive. Sentiment is still hanging around neutral and valuations are at the higher end of the range. Volitility in the markets remains near historic lows. "In the last 20 years the VIX closed lower than 10 on a total of 11 days, and 7 of those days were in the past month. Think about that - over the past 2 decades, was the last month the most benign macro environment? (e.g. last week: Comey testimony, UK elections, ECB, geopolitical uncertainty, Qatar, FANG flash crash, etc.)," stated Marko Kalonovic, JPMorgan's head quantitative analyst. Fed rate rises and receding accommodation from ECB/BoJ will eventually undermine high valuations, just not yet. However this macro environment certainly leaves the market vulnerable to any shocks to the economy that would serve as a catalyst for the market to retreat. If you did not see it, I highly recommend reading Bob Rodriguez interview with Bill Huebscher from June 27, 2017 at Advisor Perspectives. In the interview he mentions why in his view, "We are witnessing the development of a 'perfect storm' [for the market]."
I'm watching US GDP data to see if it can accelerate above 3% in the second half of the year and if inflation data retreats. If this scenario plays out it is a positive environment near-term for stocks.
Wise investing my friends.
Please consult a qualified financial advisor before making any investment decisions. This blog is for educational purposes only and does NOT constitute individual investment advice.

